The Ultimate Guide to ELK Log Analysis
ELK has become one of the most popular log analytics solutions for software-driven businesses, with thousands of organizations relying on ELK for log analysis and management in 2021.
In this ultimate guide to using ELK for log management and analytics, we’re providing insights and information that will help you know what to expect when deploying, configuring, and operating an ELK stack for your organization.

Keep reading to discover answers to the following:
- What tools make up the ELK logging stack?
- What are the challenges of using ELK for log analytics and management?
- What are common Elasticsearch logging best practices?
- What are nodes, shards, and clusters in Elasticsearch?
- Should I use Elasticsearch as my primary log data store?
- What are the best alternatives to ELK?
Inside the ELK Logging Stack?
The ELK stack consists of three open-source software tools -- Elasticsearch, Logstash, and Kibana -- that, when integrated, create a powerful solution for aggregating, managing, and querying log data in a central location from on-prem or cloud-based IT environments.
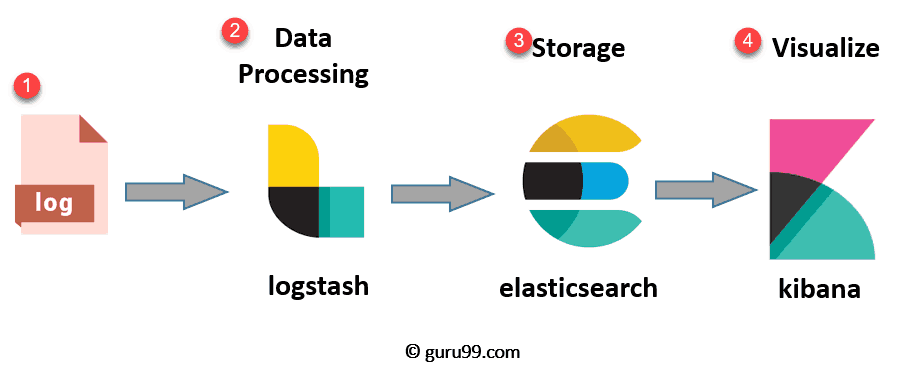
Architectural overview of ELK stack for log analysis and management.
Image Source: Guru99
Elasticsearch
Released by Elastic in 2010 and based on Apache Lucene, Elasticsearch is a popular full-text search engine that underpins the ELK or Elasticsearch stack. DevOps teams can use Elasticsearch to index, query, and analyze log data from multiple sources within complex IT environments, supporting log management use cases like security log analysis and troubleshooting cloud-based apps and services.
Logstash
First released by Elastic in February 2016, Logstash is a server-side data processing pipeline that can ingest and collect logs from a variety of data sources, apply parsing and transformations to the log data, and send it on to an Elasticsearch cluster for indexing and analysis.
Kibana
Initially developed in 2013, Kibana is an open-source, browser-based data visualization tool that integrates with Elasticsearch in the ELK stack. Kibana enables users to explore log aggregations stored in Elasticsearch indices.
DevOps teams can use Kibana to explore and analyze their log data, creating visualizations and dashboards that help analysts consume the data and extract insights.
Why Use Elastic Log Management?
The ELK stack has become popular as a log management tool for enterprise organizations. Here’s why so many DevOps teams are using the Elastic logging:
- Critical Importance of Logs - Log analytics provides critical visibility of IT assets and infrastructure for software-dependent organizations, satisfying use cases like cloud logging, observability, DevOps application troubleshooting, and security analytics. ELK provides the capabilities that these organizations need to monitor increasingly complex IT environments.
- Open Source Solution - Elasticsearch, Kibana, and Logstash are all open-source programs. That means they’re free to download and users are permitted to build plug-ins and extensions or even modify the source code. With no software licensing costs, it’s easy for organizations to start using the ELK stack for log analytics.
- Proven Use Cases - ELK stack has been used for log management by some of the world’s largest and best-known technology companies, including Netflix and LinkedIn.
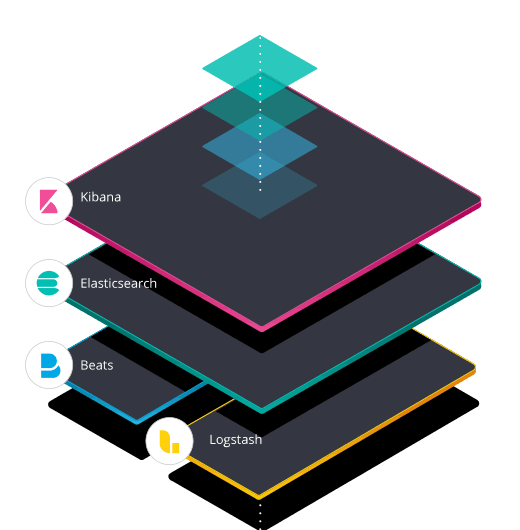
Elk Stack Visualization
DOWNLOAD: Estimate the TCO to Build and Operate an ELK Stack
The Challenges of ELK Logging at Scale
There are some common pros and cons of ELK stacks that DevOps teams will need to overcome, especially as deployments and indices scale to accommodate a growing volume of data.
Choosing a Primary Datastore for Logs
Logstash pushes logs directly into Elasticsearch, but it is usually not recommended to use Elasticsearch as the primary backing store for your log data. This is primarily due to the risk of data loss that can occur when managing larger clusters with large daily volumes of log data. Another factor is that implementing schema changes in Elasticsearch requires you to make a new index, which means migrating all of your data (lots of time, cost, and complexity as log data grows).
To prevent data loss and avoid the pain of data migrations, it’s best to choose an alternative storage backing for your log data.
Analyzing Large Volumes of Log Data
When organizations ingest large daily volumes of log data, Elasticsearch indices can become extremely large. This can lead to data usability challenges and performance degradation when querying large indices.
Adding more nodes to a cluster can improve query performance when indices are large, but this results in exponentially higher resource consumption and TCO while increasing management complexity. Instead, organizations may choose to limit their data retention and lose the ability to retroactively query their longer term log data. Data retention trade-offs are a major challenge for DevOps teams that use ELK stack for log analytics at enterprise scale.
Configuring Your ELK Stack
ELK stack is available as an open-source solution, but you’ll need to customize and configure your ELK deployment to satisfy your organization’s specific applications and use cases.
At the very least, you’ll need to deploy the three core applications of the ELK stack and get them working together.
You’ll also need to configure pipelines in Logstash to pull logs from the desired sources, implement parsing and transformations, and push the data into Elasticsearch. You’ll need to right-size your Elasticsearch cluster, configuring everything from replicas and back-ups to heap size settings. You’ll need to spend time writing queries and setting up dashboards in Kibana before you can start visualizing your data in useful ways.
As ELK stack deployments grow in complexity, configuration becomes an increasingly complex and time-consuming task for DevOps teams.
Dealing with High Memory Consumption
As an Elasticsearch index grows in size, high memory consumption has the potential to cause technical issues that can lead to performance issues and data loss.
Elasticsearch uses heap memory from the host system’s physical memory, usually set at 50% of the total available RAM, to store metadata about clusters, indices, shards, segments, and field data. As Elasticsearch indices reach terabyte scale, they may require 10-20 GB or more of heap memory to function. When heap memory consumption exceeds Elastic’s recommended maximum of 30 GB, stability issues may arise as operations fail due to insufficient memory available.
Managing an ELK stack deployment with large data indices means you’ll need to effectively monitor and manage your memory consumption to avoid stability issues.
ELK Stack Management Complexity
The complexity of managing an ELK stack increases as the deployment and indices grow in size. Managing the ELK stack includes tasks like:
- Editing and optimizing Logstash pipeline configurations,
- Reviewing index settings, mappings, and statistics,
- Performing index operations to optimize data storage efficiency,
- Managing the lifecycle of indexed data to maximize value creation,
- Implementing and managing back-up clusters,
- Building visualizations, dashboards, and reports that demonstrate query results, and
- Managing user access and credentialing.
ELK stack management only gets more complex and time-consuming as deployments scale, requiring additional man-hours from DevOps teams to ensure optimal performance and value creation when using the ELK stack for log analytics and management.
In late 2022 and early 2023, serverless Elasticsearch was announced for customers. The goal of this serverless architecture option was to reduce the management complexity associated with these services, simplifying ingestion and lowering the cost of retention. Despite promises, these changes fall short and mask existing complexity.

Elasticsearch Logging Best Practices
To start using ELK for log analysis and management, you’ll need to deploy, configure, and manage all three software components of the stack: Logstash, Elasticsearch, and Kibana.
Logstash - Log Data Aggregation and Processing
Logstash is used to aggregate log files from a variety of sources and send them to Elasticsearch.
Logstash uses customized input plugins to read logs from a variety of data sources, including system logs, server logs, application logs, windows event logs, security audit logs, and more. DevOps teams can find over 200 pre-built plugins on the Logstash github page, enabling Logstash to capture log and event data from a variety of sources, including:
- Azure Event Hubs
- AWS CloudWatch API
- Google Cloud Storage buckets
- Amazon S3 storage buckets
- HTTP or IMAP servers
- DNS servers
- Syslog file
- TCP sockets
- Elasticsearch clusters
- IRC servers
- AWS Kinesis streams
- Twitter Streaming API
- Cloud-based applications
- Cloud services
- …and a lot more…
If a plug-in does not exist for the desired application or log data source, DevOps teams have the flexibility to code their own and may even choose to share it with the Logstash community.
Deploying Logstash means setting up a Logstash server with at least one node, though a minimum of two nodes is recommended to ensure service uptime and stability. Logstash servers can be deployed on-premises or in the cloud, depending on user requirements for flexibility, scalability, and data privacy.
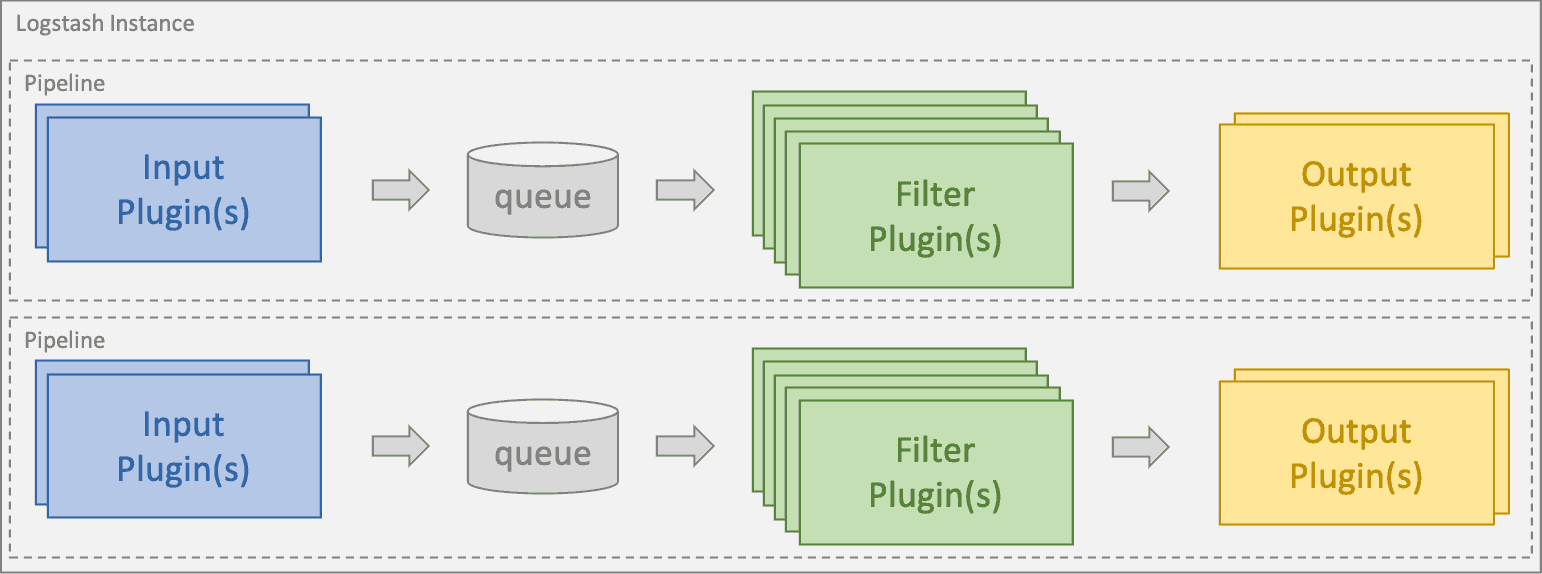
Logstash Data Processing Flow
Image Source: Elastic
DevOps teams can configure one or more pipelines within each node instance of Logstash. A pipeline uses input plugins to aggregate data from multiple sources into a queue. Data in the queue is processed in micro-batches using filter plugins that can parse, transform, and enrich the log data. Finally, output plugins format the logs and send them on to the desired destination - in the ELK stack, that destination is usually Elasticsearch.
READ: The Business Case for Switching from the ELK Stack
Elasticsearch - Log Data Storage and Indexing
Aggregated log data from all sources is stored and indexed in Elasticsearch.
Elasticsearch uses RESTful APIs to integrate with data ingestion tools like Logstash that send data to Elasticsearch in JSON document format. JSON documents are stored in Elasticsearch as an inverted index where every word that appears in every indexed document is mapped to the specific document(s) containing that word. This indexing pattern enables rapid text-based search and retrieval of log data in JSON format.
Watch this quick demo to see how to solve some JSON log challenges:
A deployed instance of Elasticsearch is called a node. To take advantage of distributed data processing capabilities, Elasticsearch nodes can be deployed and managed in an Elasticsearch cluster, which is a coordinated group of nodes that share the same cluster.name attribute.
Adding nodes to a cluster increases both its processing capacity and reliability. While smaller teams might deploy an Elasticsearch cluster with just a few nodes, large teams using ELK for log analysis and management have deployed and managed Elasticsearch clusters with hundreds of nodes.
Within a cluster, individual nodes may be assigned their own roles, including:
Master Node - Master nodes orchestrate management and configuration actions within the cluster. In a cluster with a single node, that node can function as both the master node and a data node.
Ingest Nodes - An ingest node has the ability to apply an ingest pipeline to a JSON document before indexing the data.
Transform Nodes - A transform node can convert existing Elasticsearch indices into summarized indices to potentially reveal new insights.
Data Nodes - A data node can hold data and perform data-related operations, including searches and aggregations.
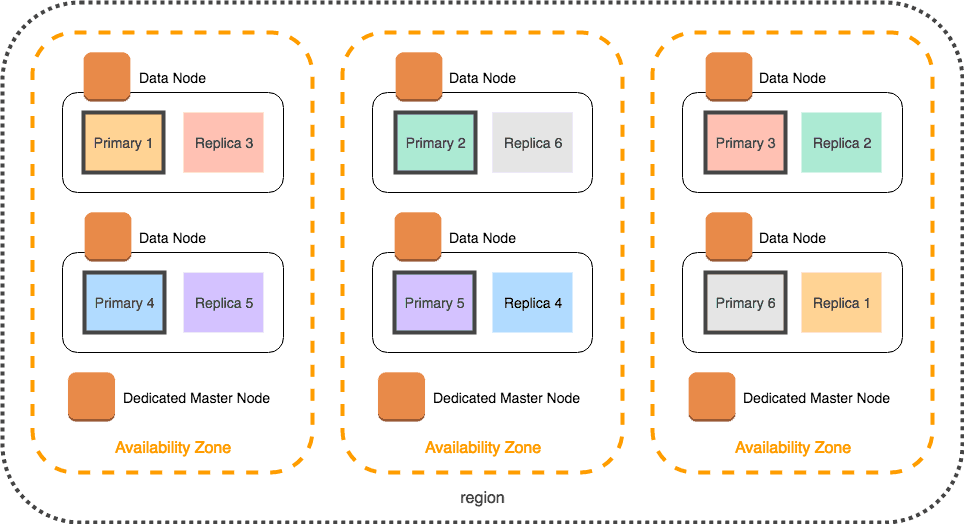
An Elasticsearch cluster deployed in AWS with nodes distributed across multiple availability zones (AZs). Each AZ has its own dedicated master node and two data nodes. Each node contains a primary shard and a replica of a shard in another AZ. Distributing replicas in this way ensures data redundancy in case of hardware failure and adds capacity for read requests.
Image Source: AWS
Elasticsearch receives aggregated log data from Logstash and stores the data in an index. The index is split into shards and stored across multiple data nodes within an Elasticsearch cluster to enable distributed data processing and enhance query performance. Each primary shard has a replica on another node to ensure data redundancy in case of hardware failure.
Elasticsearch instances can be deployed in the cloud or on a local server. Organizations may also choose to deploy Elasticsearch as a managed service with support from Amazon (Amazon OpenSearch) or from Elastic NV (Managed Elasticsearch).
Once logs have been indexed in Elasticsearch, DevOps teams can query their log data using Kibana.
Kibana - Log Data Visualization and Dashboards
Kibana acts as a front-end to Elasticsearch, allowing DevOps teams to query their underlying log data using the Kibana Query Language.
With Kibana, DevOps teams can perform text-based searches on their log data, then create visualizations of their log data in a variety of formats, including histograms, line graphs, sunbursts, pie charts, and more. Location, time-series, and machine learning data can also be visualized using Kibana.
Kibana dashboards combine multiple data visualizations into a single pane of glass that delivers real-time analysis and insights as log data flows from Logstash into Elasticsearch.
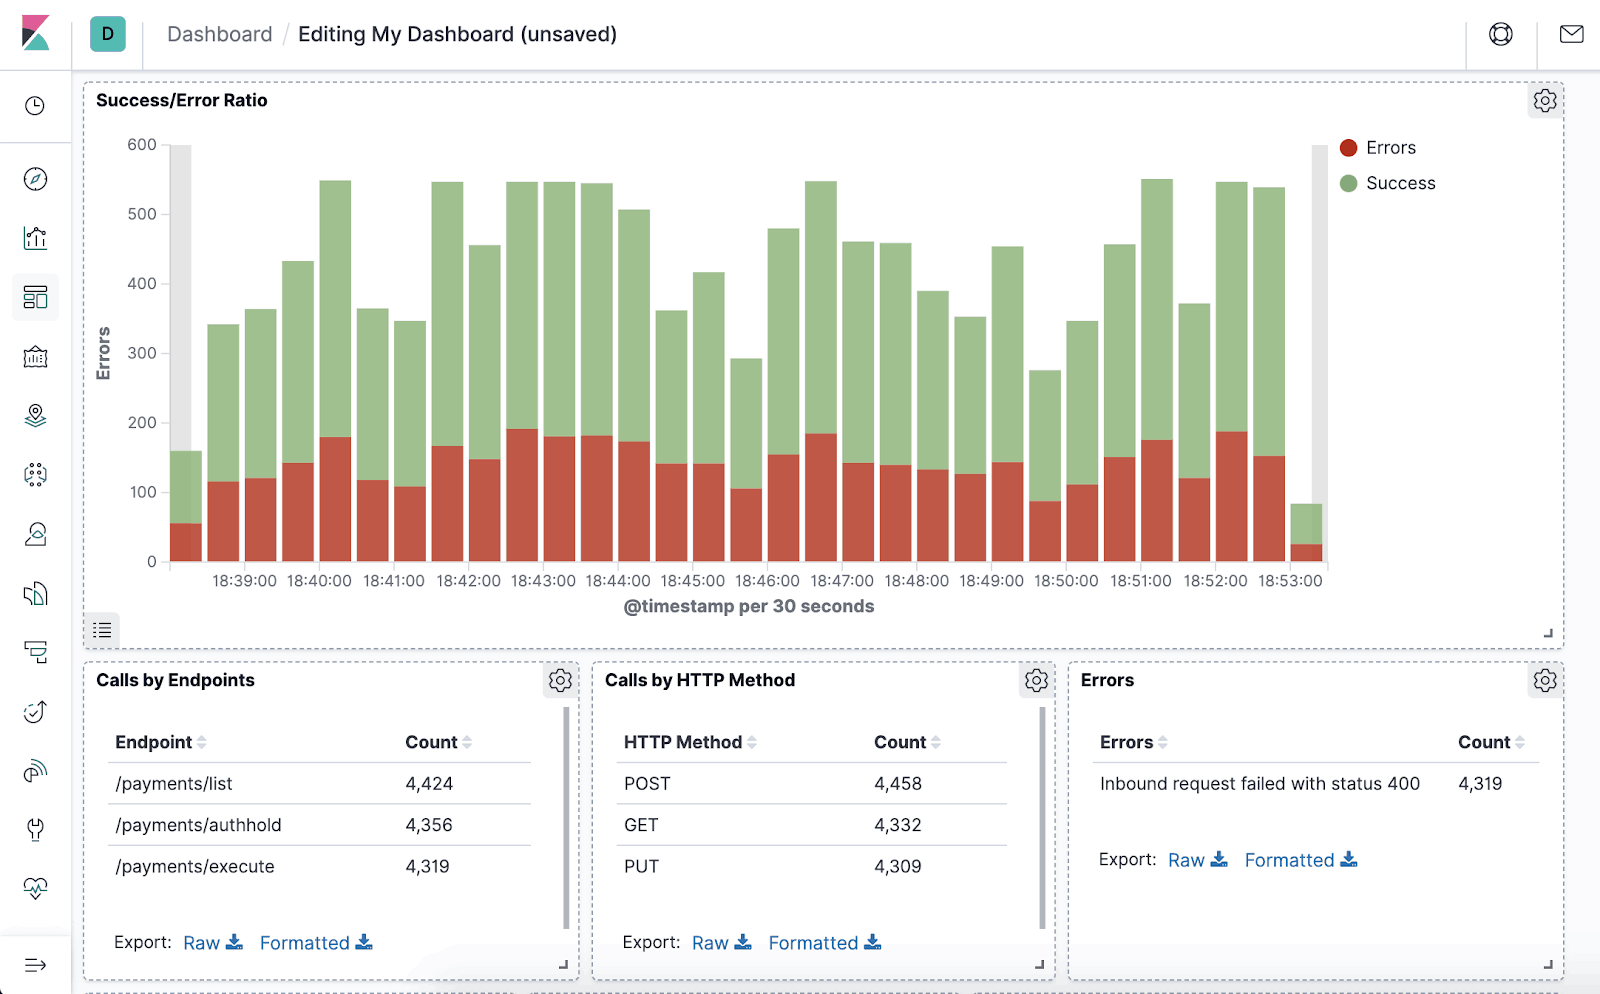
Kibana dashboards make it easy for analysts to visualize and consume log data from Elastic indices.
Image Source: Preslav Mihaylov
Kibana can be deployed on a local server, in the cloud, or as a managed service through Elastic NV or a third-party MSP.
An Alternative to Elastic Logging
For many organizations struggling to manage the cost and complexities of the ELK stack at scale, ChaosSearch is an emerging alternative. With ChaosSearch, customers perform scalable log analytics on AWS S3 or GCS, using the familiar Elasticsearch API for queries, and Kibana for log analytics and visualizations, while reducing ELK stack costs and improving analytical capabilities.
DevOps teams can ingest log data into Amazon S3, index logs with the patented Chaos Index® technology, explore data with full-text search, execute SQL queries on log data, and build visualizations or dashboards using the familiar Kibana Open Distro interface.
ChaosSearch enables log management at scale with significantly reduced management complexity and TCO compared to the ELK stack.


